The Daily Reveille pulled data from BRgov.com to show how many traffic incidents occurred during Friday’s winter storm in Baton Rouge using an interactive map and graph.
Use the traffic map’s scroll bar and am or pm options to change the time and location for each incident. Hovering over or clicking an x shows the longitude, latitude, address and the number of incidents.
The second graph shows the number of incidents by time of day. Click here for our mobile version.
Interactive: Snow Day Incidents
January 26, 2014
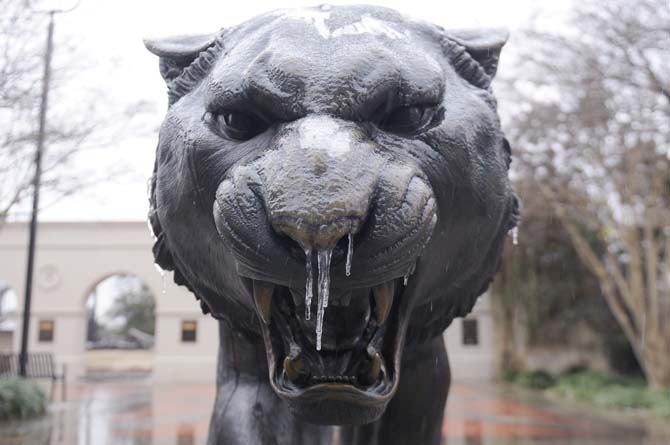
A statue of Mike VI is covered in ice near Mike’s habitat Saturday, Jan. 25, 2014.


